We understand that while we have a lot of standard reports available that meet universal needs across New York State districts, each of our customers still have their own unique challenges or offerings that may require a customized report. While SchoolTool customers can customize reports on their own, our team can take the lead and build a custom report for you when you can’t quite get to where you’re trying to go on your own.
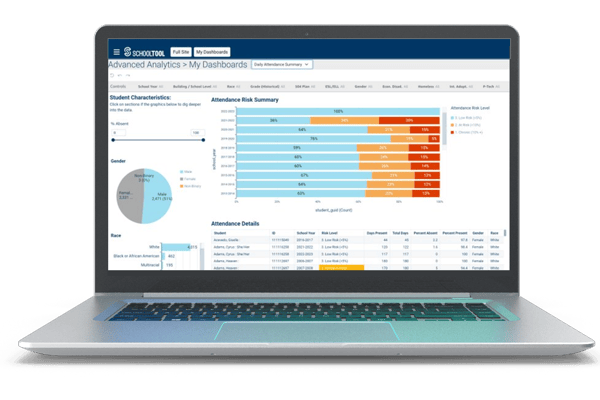
An example of SchoolTool’s custom report development is with a report built in collaboration with BT BOCES to tackle their unique circumstances around attendance. While many attendance reports can only capture one daily absence, many of BOCES have half-day sessions (morning and afternoon) that they need to log student absences for separately. At the time, the system didn’t allow staff to identify which session (AM or PM) the student was absent from, creating inaccurate accounting of student attendance.
Our custom report—which has since been added as a standard report offering to benefit all NYS BOCES—gives staff the flexibility to log a student’s attendance separately for morning and afternoon sessions, identify the student's primary program, they are enrolled in, and shows which period they were absent from.


 SchoolTool helps wrangle student data and reporting, so you can focus your time on connections and relationships.