 SchoolTool
Are You Really Doing MTSS?
 Mindex: Oct 20, 2026, 9:16:07 AM
Most districts have an MTSS framework. Fewer have a system that actually works. Here's how to tell the difference.
























As summer unfolds and U.S. schools enjoy a well-deserved break after the 2023-2024 academic year, September is just around the corner, marking the start of a new school year. As we prepare for this upcoming school year, one of the top concerns that has emerged in recent years is the significant spike in school absenteeism. Recent district feedback and research highlight this issue, with absenteeism rates now reaching levels not seen in decades.
In this blog post, we’ll dive into the rising trend of absenteeism in schools, explore its underlying causes, and offer insights into effective strategies and tools to address this pressing challenge.
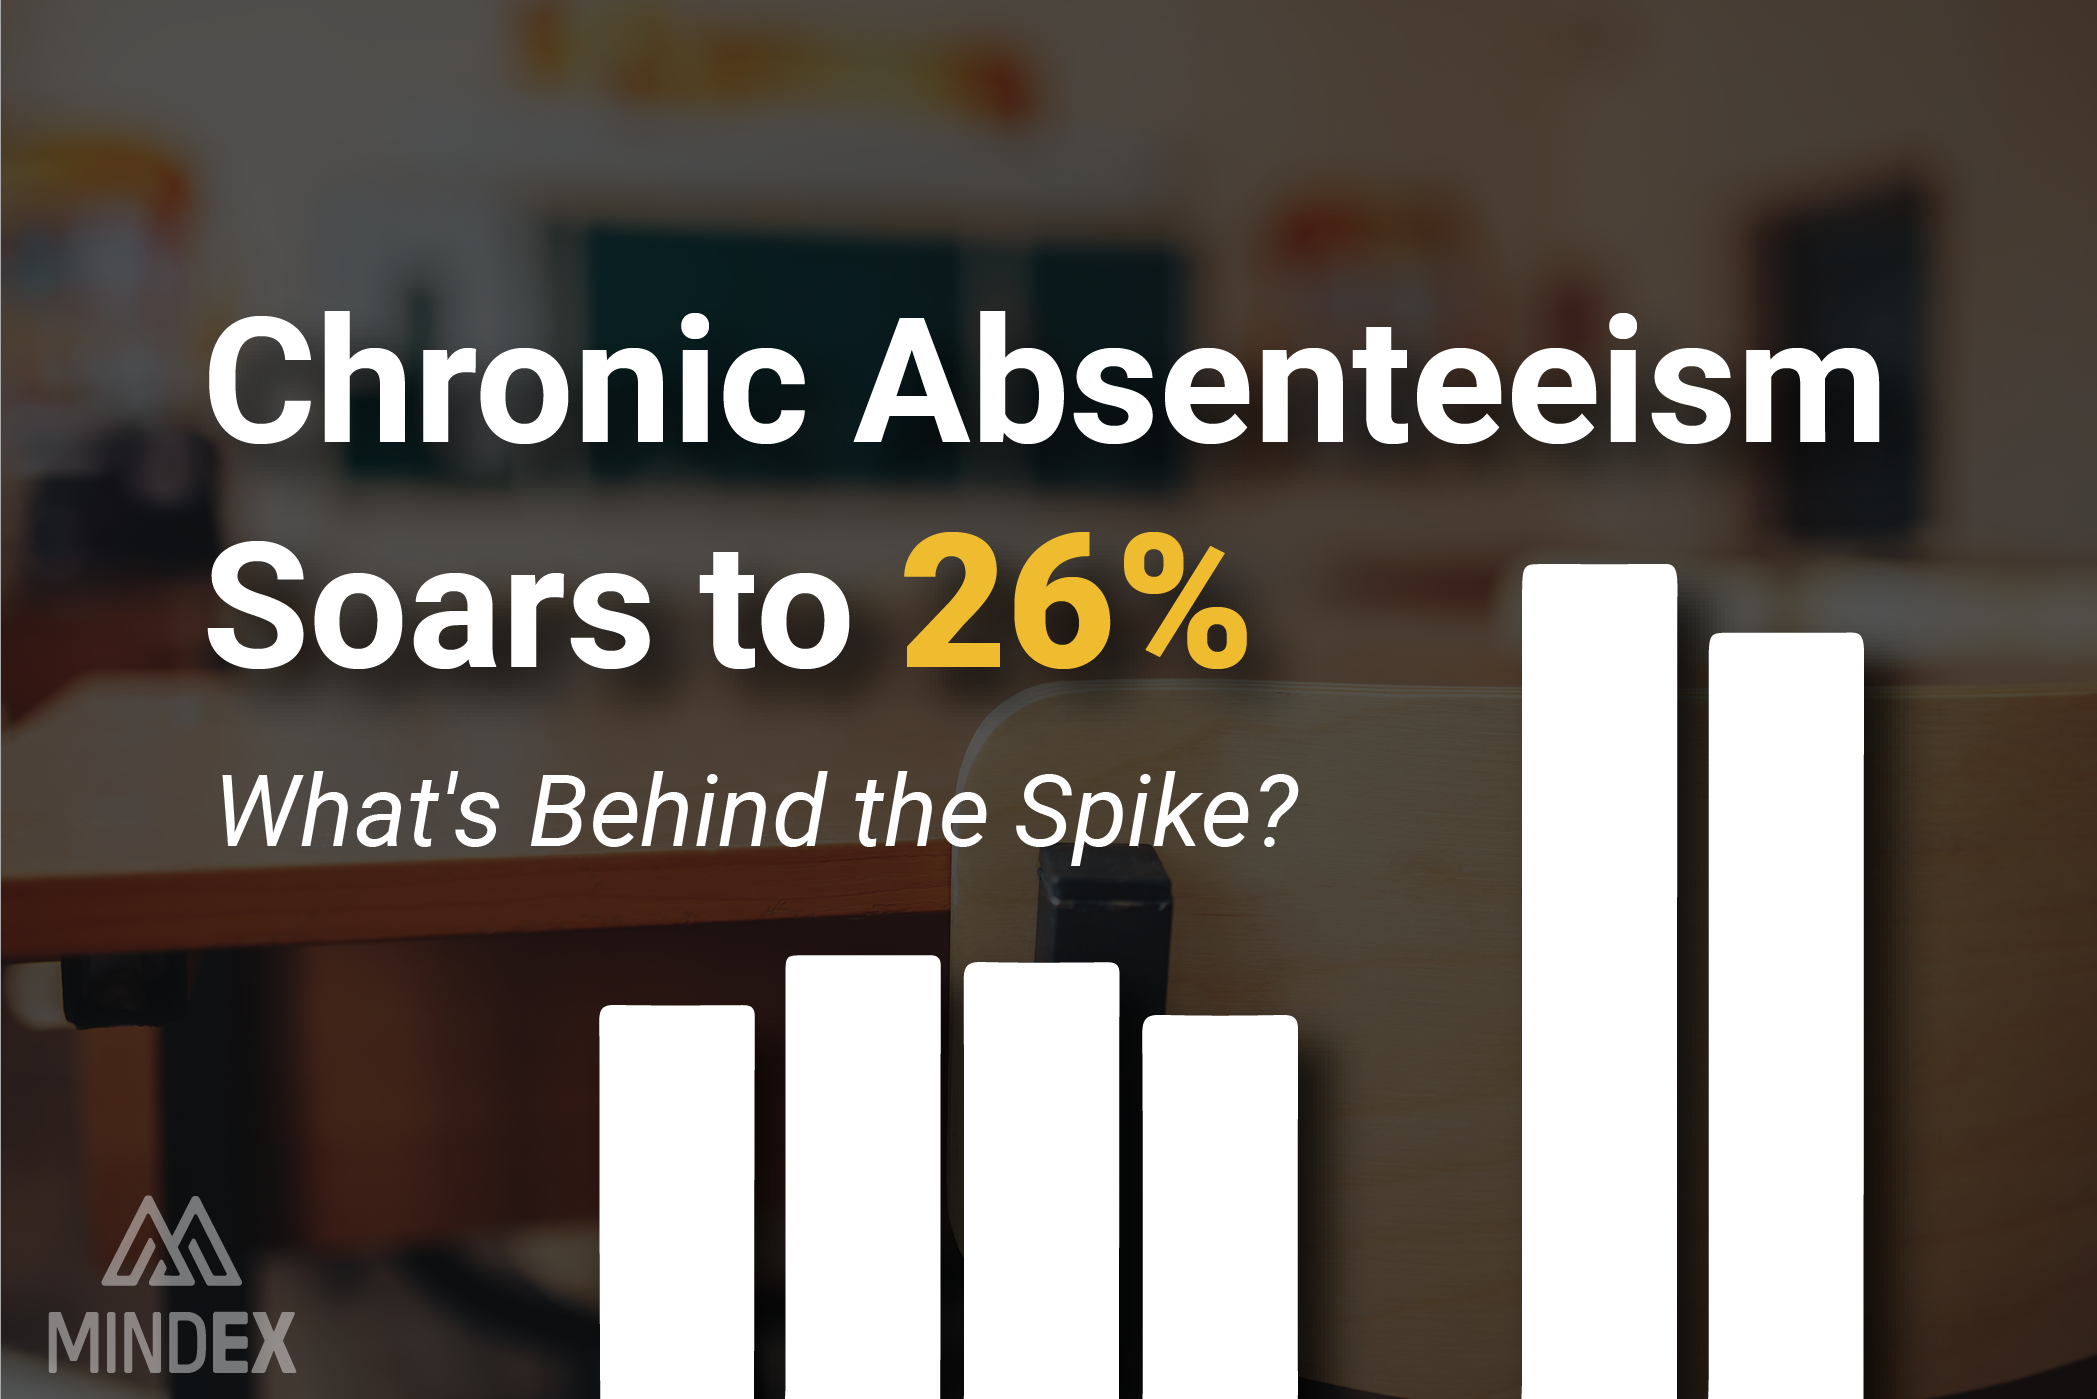
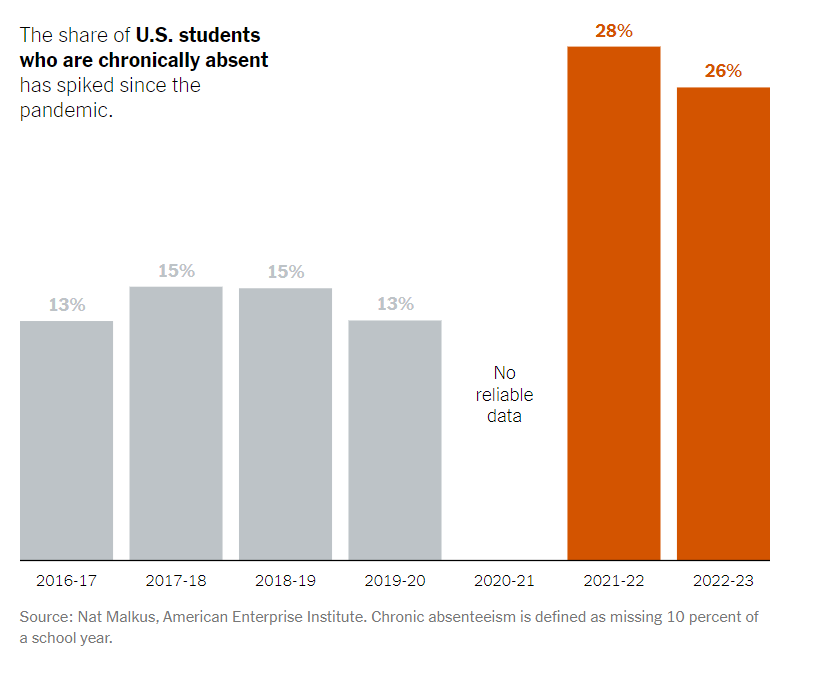
Since the COVID-19 pandemic emerged in March 2020, U.S. education has faced unprecedented difficulties, including significant learning loss, declining enrollments, and rising issues with student behavior and discipline. According to the New York Times article, “Why School Absences Have ‘Exploded’ Almost Everywhere," approximately 26 percent of public school students were considered chronically absent last school year, up from 15 percent before the pandemic. Chronic absence is defined as missing at least 10 percent of the school year—about 18 days—for any reason.
For high school students in New York State, absenteeism surged dramatically during the pandemic. The rate rose from 24.5% before the pandemic (2018-19) to a concerning 37.8% during the peak of the pandemic (2021-22). While there has been a slight improvement, with absenteeism falling to 34.1% in the 2022-23 school year, the elevated levels remain a significant concern.
Similarly, elementary and middle school students saw a notable increase in absenteeism. Rates climbed from 15.6% before the pandemic to 29.8% during the pandemic. The following year saw a decrease to 26.4%, but the overall increase reflects ongoing challenges in maintaining consistent school attendance.
As we seek to understand the surge in Absenteeism, The New York Times article mentioned earlier outlines several factors, which are echoed by SchoolTool district feedback and observations.
Socioeconomic Factors: Absenteeism affects both higher and lower-income families, albeit in different ways. For higher-income families, absences can be linked to planned vacations or off-peak travel, which, while intentional, might significantly contribute to overall absenteeism rates. Conversely, students from lower-income backgrounds might face unique challenges impacting their ability to attend school regularly. Examples include responsibilities at home, such as caring for younger siblings, and logistical difficulties like lack of transportation. Economic stress and limited access to resources can also affect their health and school attendance.
Health and Mental Health Issues: The pandemic has intensified health and mental health issues among students. Routine illnesses, mental health challenges, and stress have all contributed to increased absenteeism, as students struggle with the emotional and physical demands of returning to school.
Remote Work for Parents: The flexibility of remote work has allowed parents to spend more time at home, making them more available to manage their children’s needs. This increased parental presence can lead to a more relaxed approach to school attendance, as parents might permit children to stay home more frequently.
Addressing absenteeism requires effective strategies, tools, and interventions. Through conversations with K-12 technology partners and school districts, as well as additional research, we want to highlight several ideas and outcomes we’ve identified:
Research by the Institute of Education Sciences (IES) highlights text messaging as a cost-effective strategy for enhancing family engagement and reducing chronic absenteeism. The IES toolkit supports districts in implementing this approach by forming attendance teams, automating the messaging system, and integrating it with student information systems, such as ParentSquare with SchoolTool. Evaluations of this strategy show that various text types—such as weekly reminders, same-day personalized alerts, and intensified outreach for families with high absenteeism—can reduce chronic absenteeism by 12 to 18 percent.
The Greater Johnstown School District exemplifies effective parent engagement by sending informative letters that clearly outline the impacts of absenteeism. Nicole Panton, the district’s director of curriculum and instruction, explained to the New York State School Boards Association, “Now at our elementary schools, we send out a letter that's like 'An average fourth grader misses five days of school, and your fourth grader has missed 10 days.’” The district also includes facts about chronic absenteeism to help families understand how many days their child is actually missing. This approach, which began before the pandemic, is part of a broader strategy that also includes a K-12 mentoring program, additional staff such as counselors and psychologists, and guidance from Attendance Works.
The Frankfort-Schuyler Central School District employs a proactive approach by releasing attendance data every five weeks to keep the community informed. A dedicated committee of counselors, social workers, teachers, and administrators reviews this data regularly to develop targeted strategies for students with high absenteeism rates. Superintendent Joe Palmer emphasizes the importance of including students and parents in these discussions, stating, "Sometimes it's better just to ask them - 'What do you need?'" This method, combined with initiatives like a weekend backpack program—which provides meals for students over the weekend—and the Hi-5 Friends mentoring program, has reduced the district's chronic absenteeism rate from 20% to 12% over four years, as reported by the New York State School Boards Association.
The 2020 report by the Regional Educational Laboratory (REL) Mid-Atlantic, titled Using Data from Schools and Child Welfare Agencies to Predict Near-Term Academic Risks, offers valuable insights into data-driven strategies for improving educational outcomes.
The report shows that predictive models using machine learning can accurately identify at-risk students by analyzing both in-school variables (e.g., attendance, behavior) and out-of-school factors (e.g., child welfare involvement, emergency homeless services). These models enable schools to proactively address issues like absenteeism and poor grades, aiming to prevent dropouts and enhance overall student success.
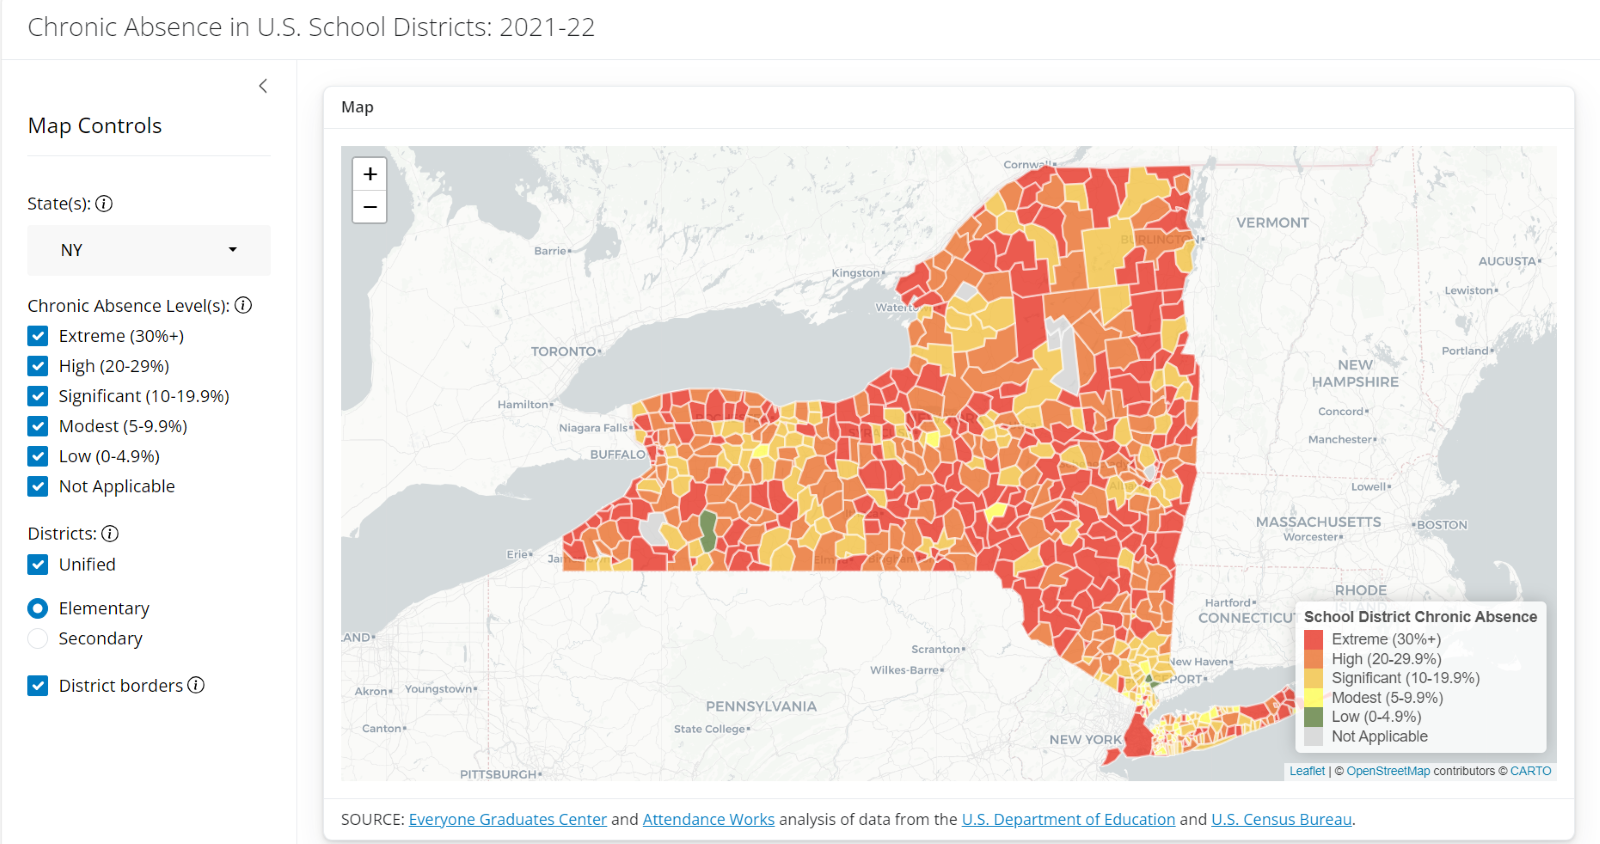
At SchoolTool, we offer a range of dashboards tailored to meet the needs of Districts, BOCES, and RICs. The snapshot below, from the Everyone Graduates Center’s “Chronic Absence in U.S. School Districts,” illustrates the significant absenteeism challenge in New York State based on 2021-22 data.
We are committed to working with districts, schools, and community partners to address absenteeism and improve student outcomes.
Our absenteeism dashboards are designed to help schools identify students at risk by providing a comprehensive view of attendance data. Our dashboards are divided into four main sections: What’s Happening Now, Exploratory, Comparison, and Accountability.
.gif?width=1296&height=720&name=Dashboard%20GIF%20(1).gif)
The What’s Happening Now tab offers a general overview, showing the percentage and number of students by risk level, based on New York State’s chronic absenteeism standards.
The Exploratory tab delves deeper, presenting percentages of students by building and risk level across different school years, enabling schools to track attendance trends and filter data by various attributes.
The Comparison tab allows for side-by-side analysis of different groups or time periods, facilitating a clear understanding of changes and patterns in absenteeism.
Lastly, the Accountability tab focuses on key sub-groups such as race, disability, non-English speaking learners, and economic status, showing the proportion and number of students in each risk level. This data is filterable and adjustable, providing schools with the tools to identify and support at-risk students effectively.
As we mentioned earlier in this blog post, schools are also contending with heightened discipline problems, often linked to absenteeism. To continue to address this, we've added a risk level component to our discipline dashboard.
Along with showing specific incident breakdowns, we provide a brief explanation of where the numbers come from and continue to adjust risk levels based on district feedback. We understand that what is considered high risk can vary between districts, so soon, districts will be able to set their own thresholds for high and low risk.
Our Discipline dashboard allows educators to compare students with frequent incidents to those with fewer. You can filter to focus on high-risk students, view suspension data, track common incidents, and analyze incidents by week, grade level, and building.
Finally, our early warning dashboard integrates data on absenteeism, discipline, course attendance, and assessments to offer a comprehensive view of student risk. It effectively identifies high-risk students and their distribution. This reflects the strategies from the research we outlined earlier in the 2020 Regional Educational Laboratory (REL) Mid-Atlantic report, which emphasized using predictive models to identify at-risk students.
As we approach the new school year, addressing chronic absenteeism and its related issues remains a top priority. By leveraging data-driven tools like Advanced Analytics and implementing evidence-based strategies, schools can better understand absenteeism trends, engage families, and create supportive learning environments.
To see how SchoolTool can help your district improve attendance and engagement, contact us for a demo or explore our resources for further support.
New York Times. (2024, March 29). Chronic absences. The New York Times. https://www.nytimes.com/interactive/2024/03/29/us/chronic-absences.html
New York State School Boards Association. (2024, April 26). A third of HS students are chronically absent. On Board Online. https://www.nyssba.org/news/2024/04/26/on-board-online-april-29-2024/a-third-of-hs-students-are-chronically-absent/
Institute of Education Sciences. (n.d.). Absenteeism. Institute of Education Sciences. https://ies.ed.gov/EvidenceBased/absenteeism/text.asp
New York State School Boards Association. (2024, April 26). A third of HS students are chronically absent. On Board Online. https://www.nyssba.org/news/2024/04/26/on-board-online-april-29-2024/a-third-of-hs-students-are-chronically-absent/
Institute of Education Sciences. (2024). Regional educational laboratory mid-Atlantic: Publication 3946. Institute of Education Sciences. https://ies.ed.gov/ncee/rel/Products/Region/midatlantic/Publication/3946
Education Data Science Initiative. (n.d.). Chronic absence. Education Data Science Initiative. https://edu-dsi.shinyapps.io/chronic_absence/
 Mindex: Oct 20, 2026, 9:16:07 AM
Most districts have an MTSS framework. Fewer have a system that actually works. Here's how to tell the difference.
 Mindex: Oct 12, 2026, 2:30:38 PM
If you've heard increased discussion about NY Inspires over the past few weeks, you're not alone.

 SchoolTool : Dec 5, 2024, 2:32:45 PM
Mindex was featured at AWS re:Invent 2024, showcasing SchoolTool’s GenAI-powered analytics and their impact on driving student success in education.
 SchoolTool : Apr 17, 2023, 6:00:00 AM
SchoolTool Gradebook just got even better! From new features to enhanced functionality, find out what's in store with this informative update.
 SchoolTool : Apr 7, 2023, 1:51:00 PM
Stay up-to-date with SchoolTool's latest product updates! Our April roundup highlights exciting new features coming soon. Don't miss out!